Turning security noise into a clear next move
Velocity is a comprehensive cybersecurity platform for detecting and responding to threats. I designed a centralized security dashboard that turns complex security data into a practical decision-making tool.
Security teams weren't short on data — they were short on clarity. I designed for the decision, not the dashboard.
Sketching, visual design, user journeys, wireframing, dev handoff and support through development.
Figma, Miro, Notion, Zeplin, pen and paper.
1 Product Design Lead
1 Product Manager
2 Full-stack Developers
The challenges
Security teams face an overwhelming amount of information every day — alerts, incidents, risk indicators and system events, generated constantly and spread across multiple systems. The hard part isn't finding data, it's telling critical issues apart from background noise.
Designing a security dashboard meant balancing large volumes of real-time data with the need for clarity, speed, and action. Through research and exploration, I identified four core challenges to solve.
- Visualizing complex security data — present large amounts of security information in a way that's easy to scan, understand, and act upon.
- Providing context and prioritization — help users quickly understand severity, impact, and urgency through a clear visual hierarchy.
- Supporting fast decision-making — surface meaningful insights and recommended actions that let users respond quickly to threats.
- Reducing alert fatigue — highlight critical information while minimizing noise, helping users stay focused on what matters most.
Research and user needs
Through 5 user interviews and close collaboration with security stakeholders, I identified the core needs: immediate situational awareness, clear risk prioritization, actionable information (context and next steps, not just more data), real-time visibility, and reduced cognitive effort. These findings became the foundation for the dashboard structure and information hierarchy.
Wireframes
Following research and a competitive market analysis, I designed three distinct wireframe concepts for the dashboard layout and weighting system. The wireframe phase answered hard questions: what belongs above the fold, how risk indicators should be prioritized, which metrics deserve permanent visibility, and how a user moves from overview to investigation without friction.
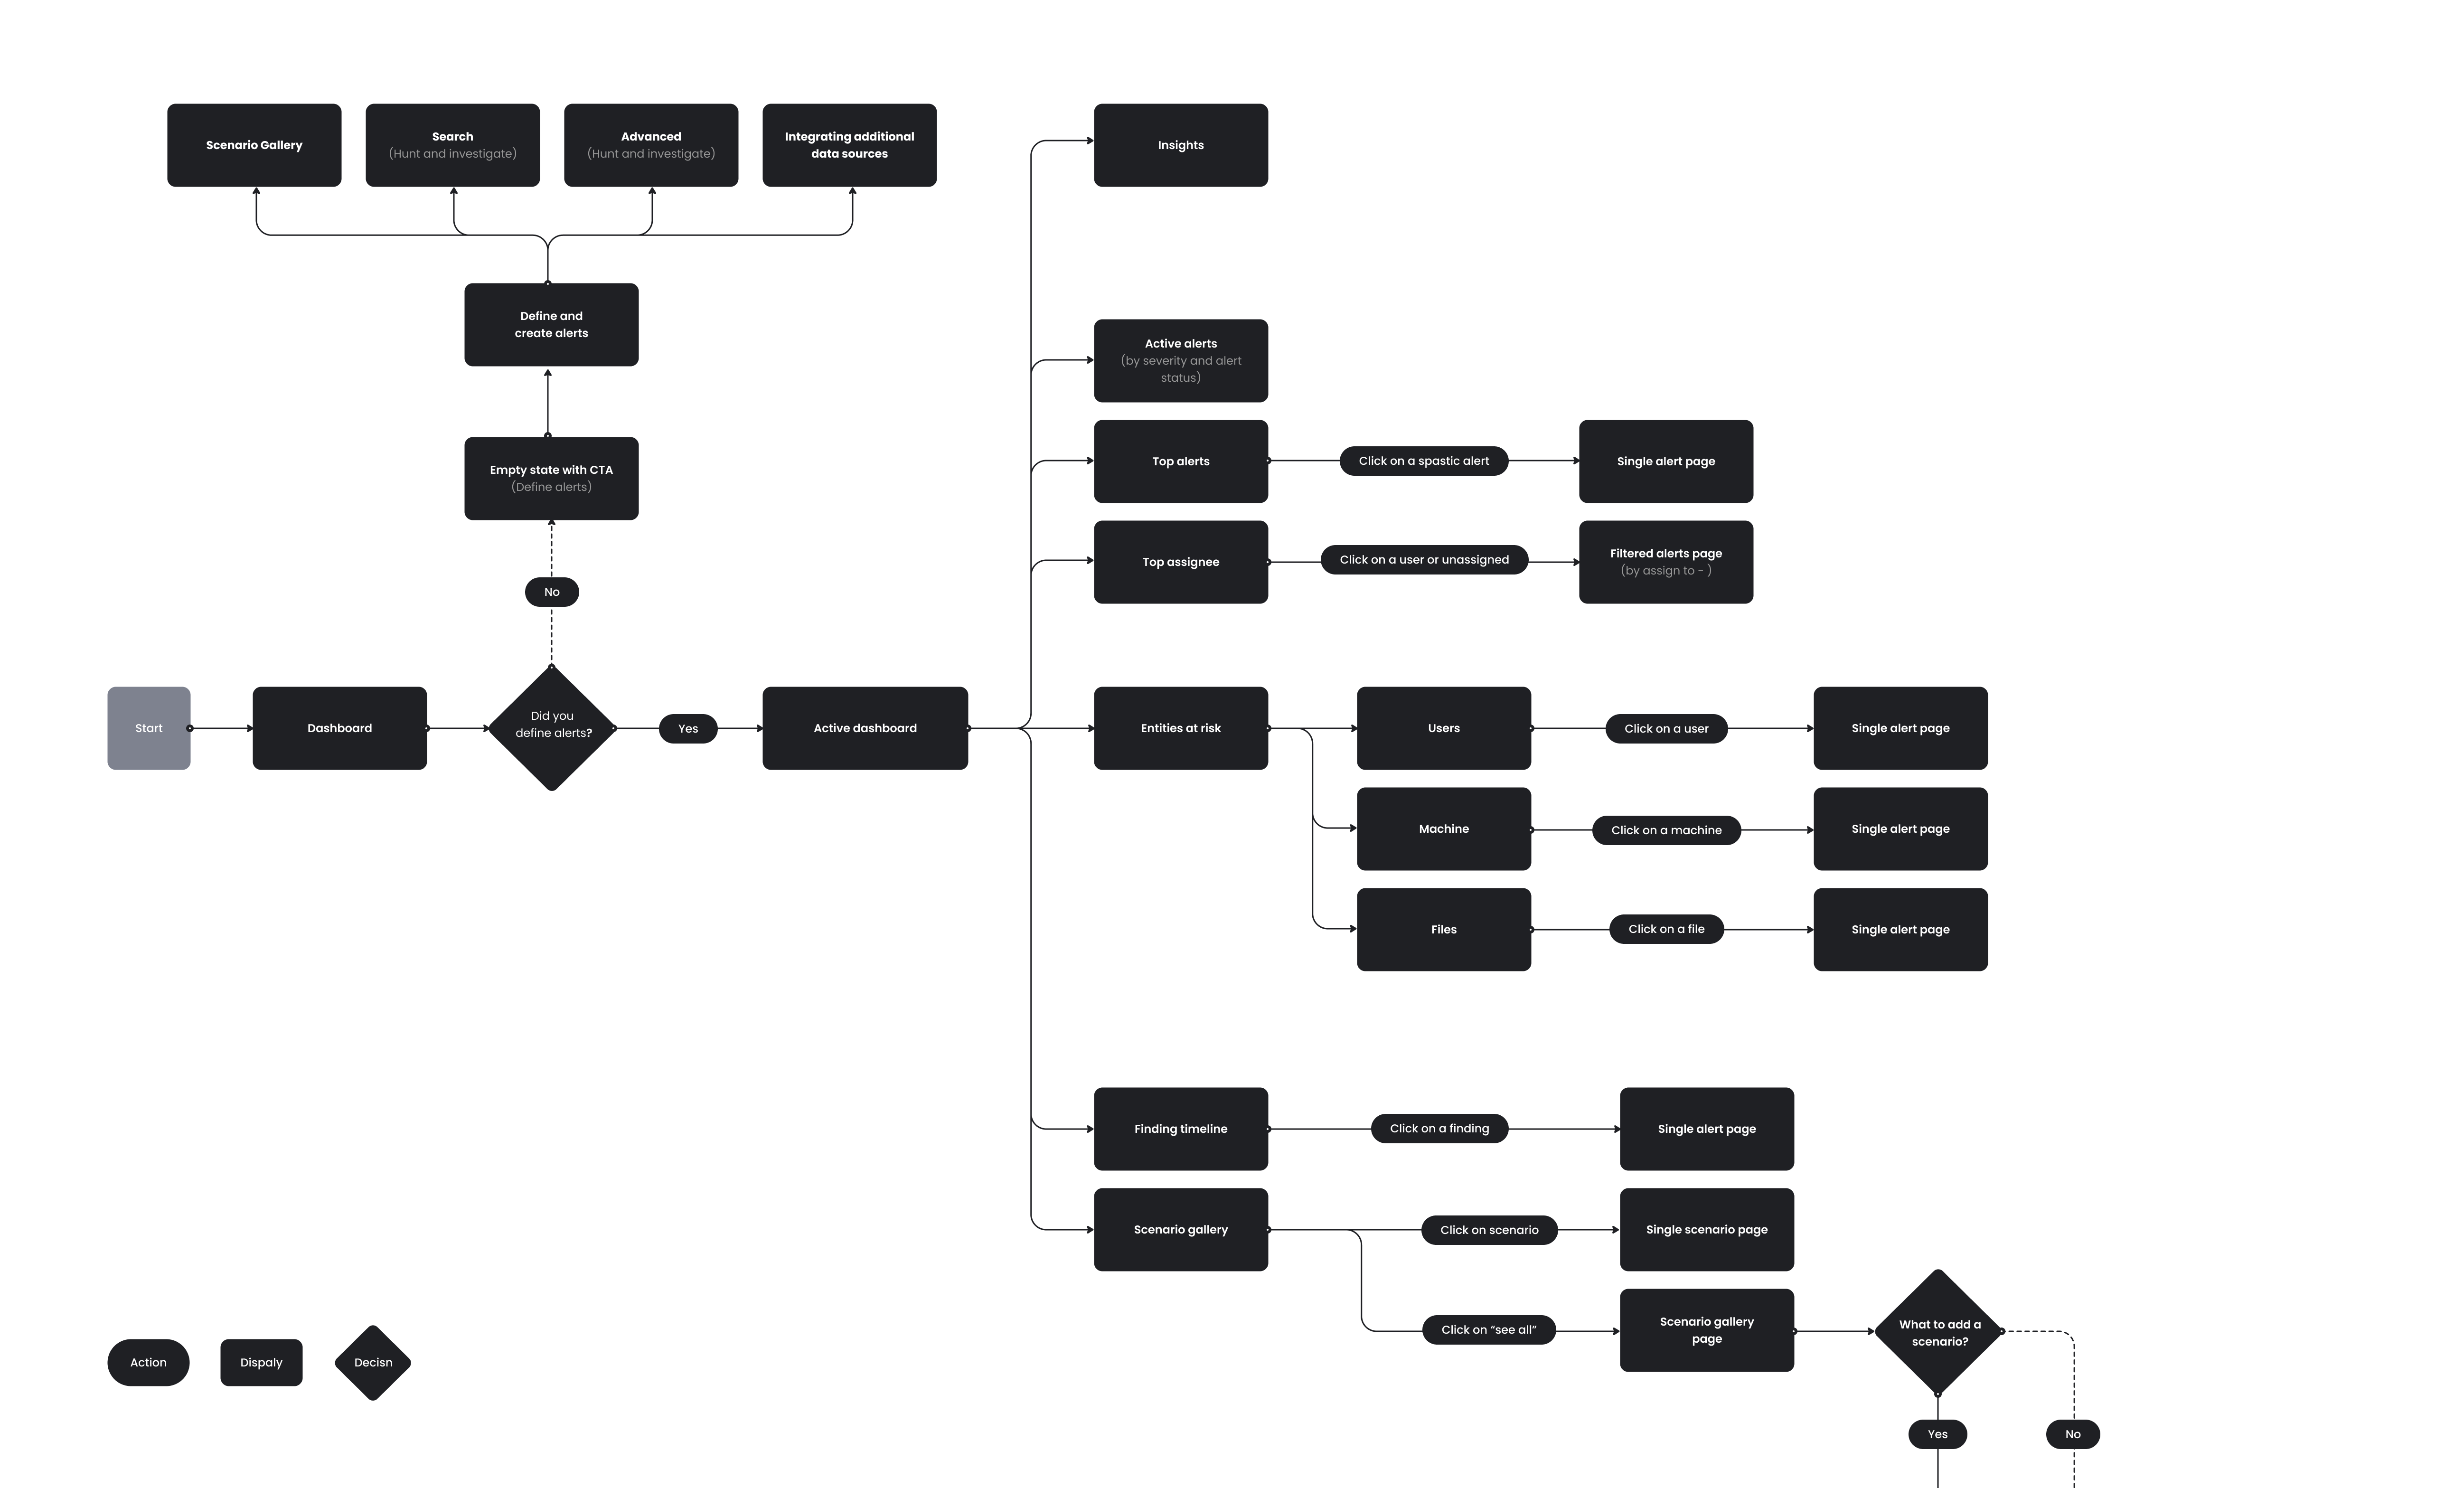
User flow
Before visual design, I mapped the investigation workflow of a security analyst — from opening the dashboard, to reviewing overall health, identifying critical alerts, investigating affected entities, understanding severity and impact, reviewing recommendations, taking action, and monitoring the outcome. Mapping it end to end surfaced the key decision points and shaped the dashboard's architecture.
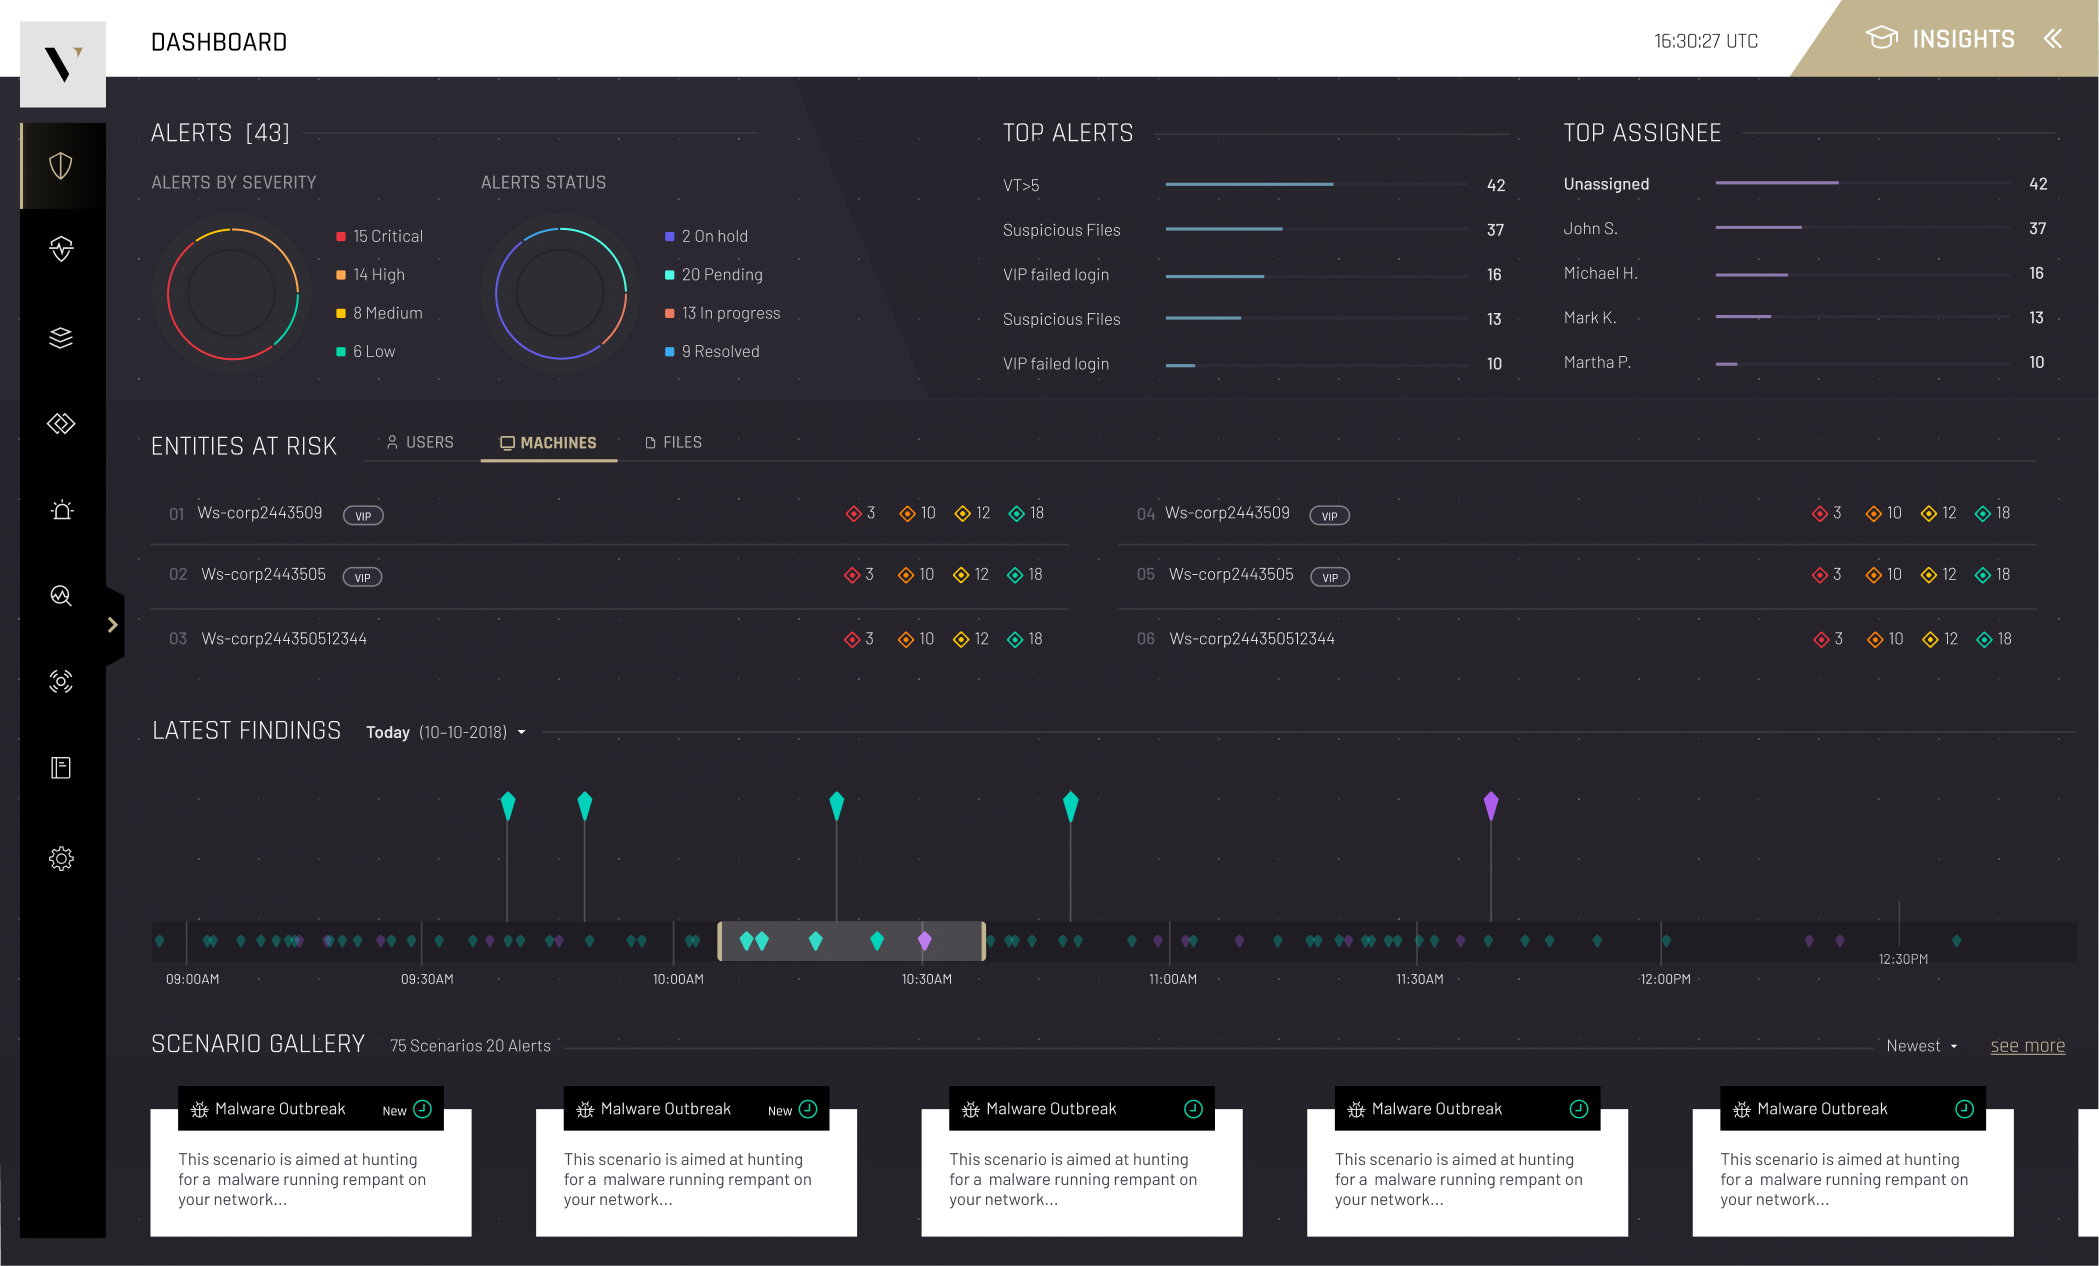
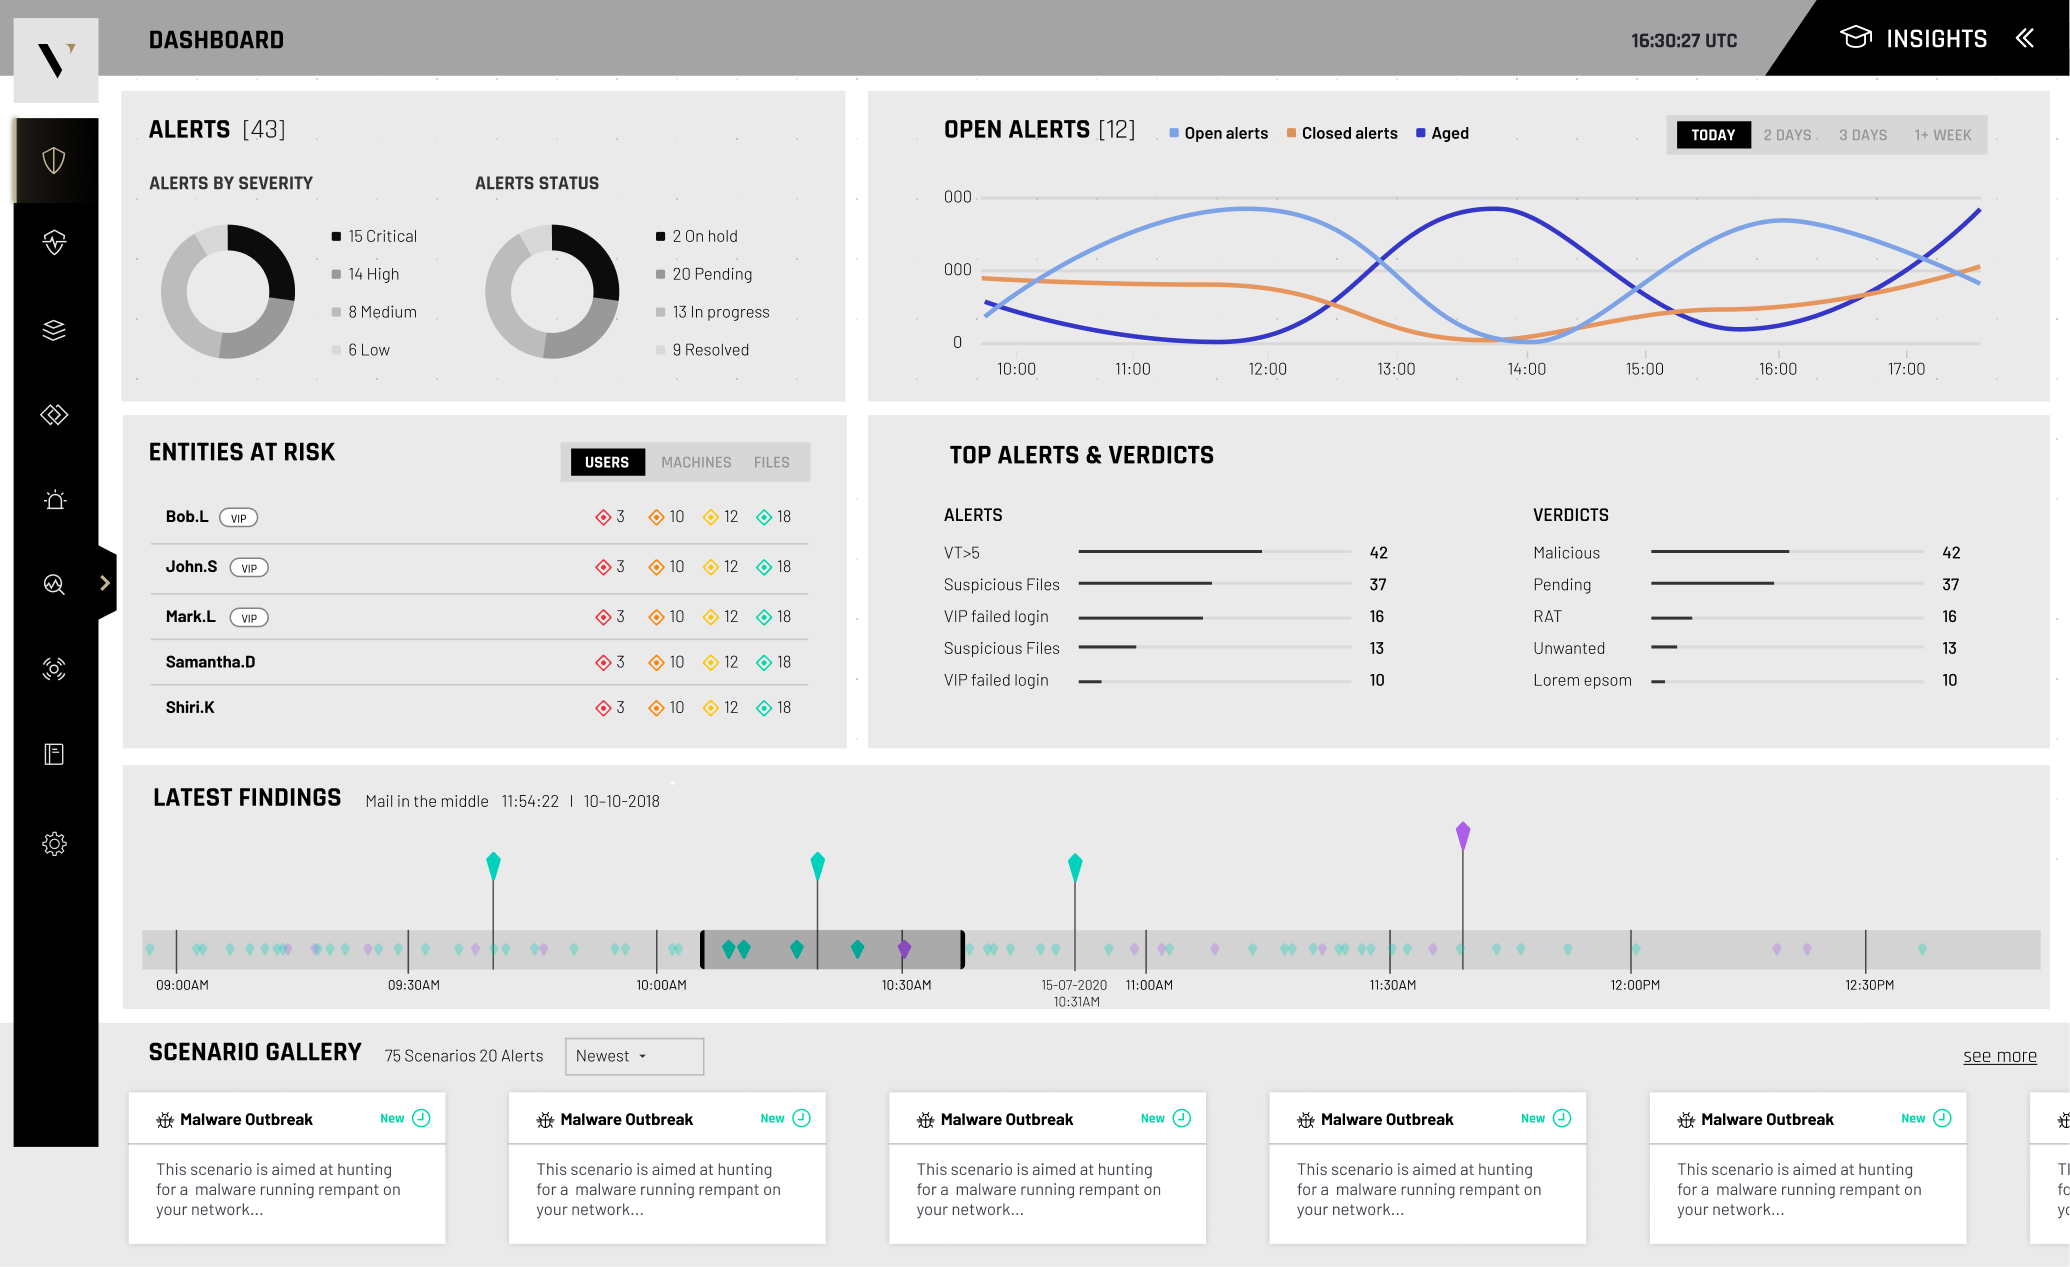
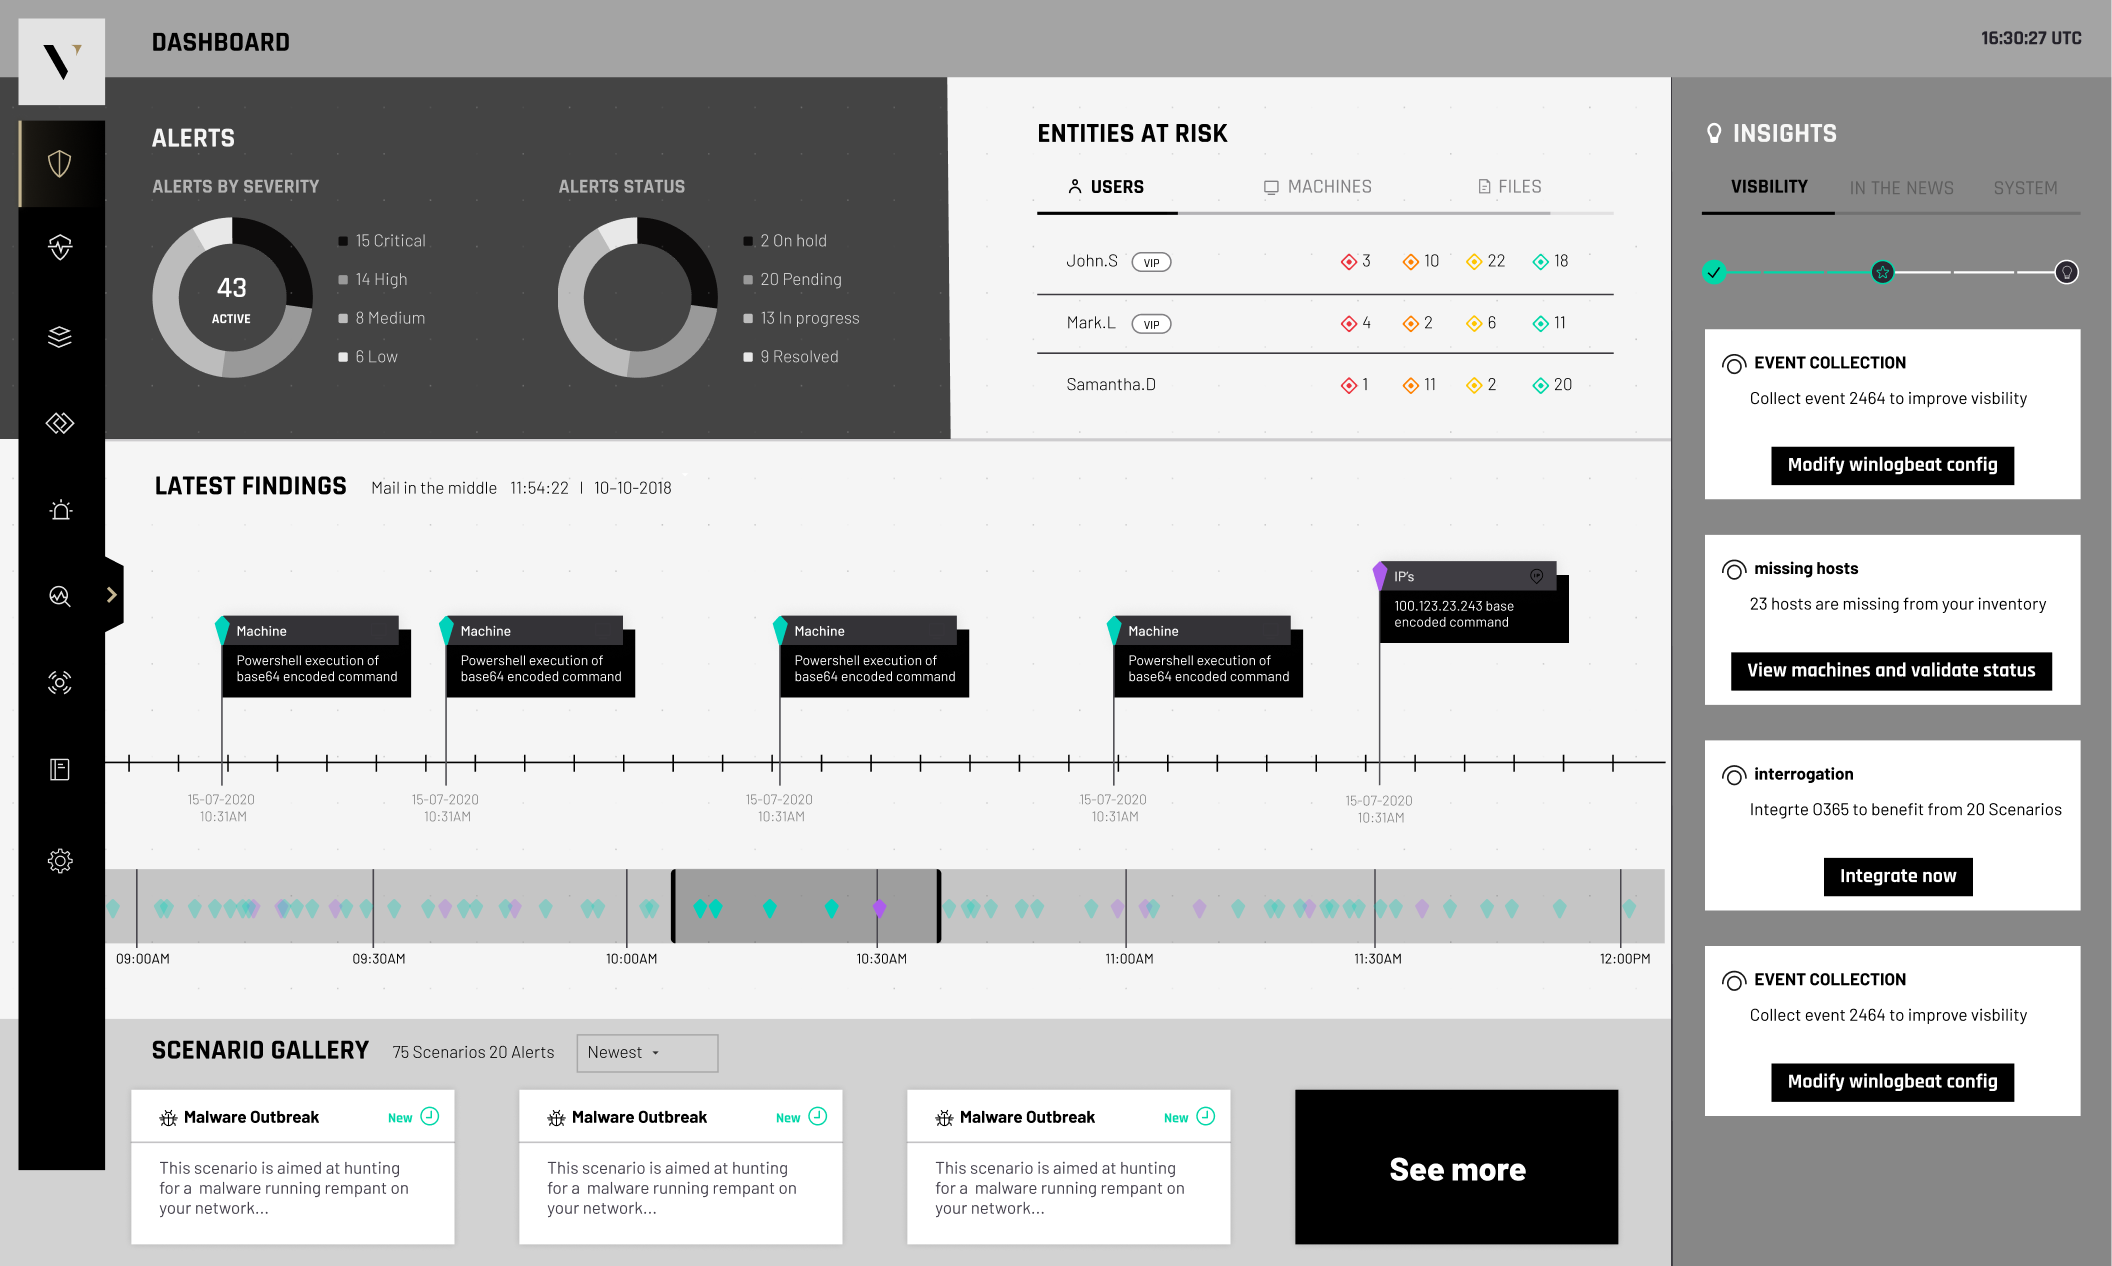
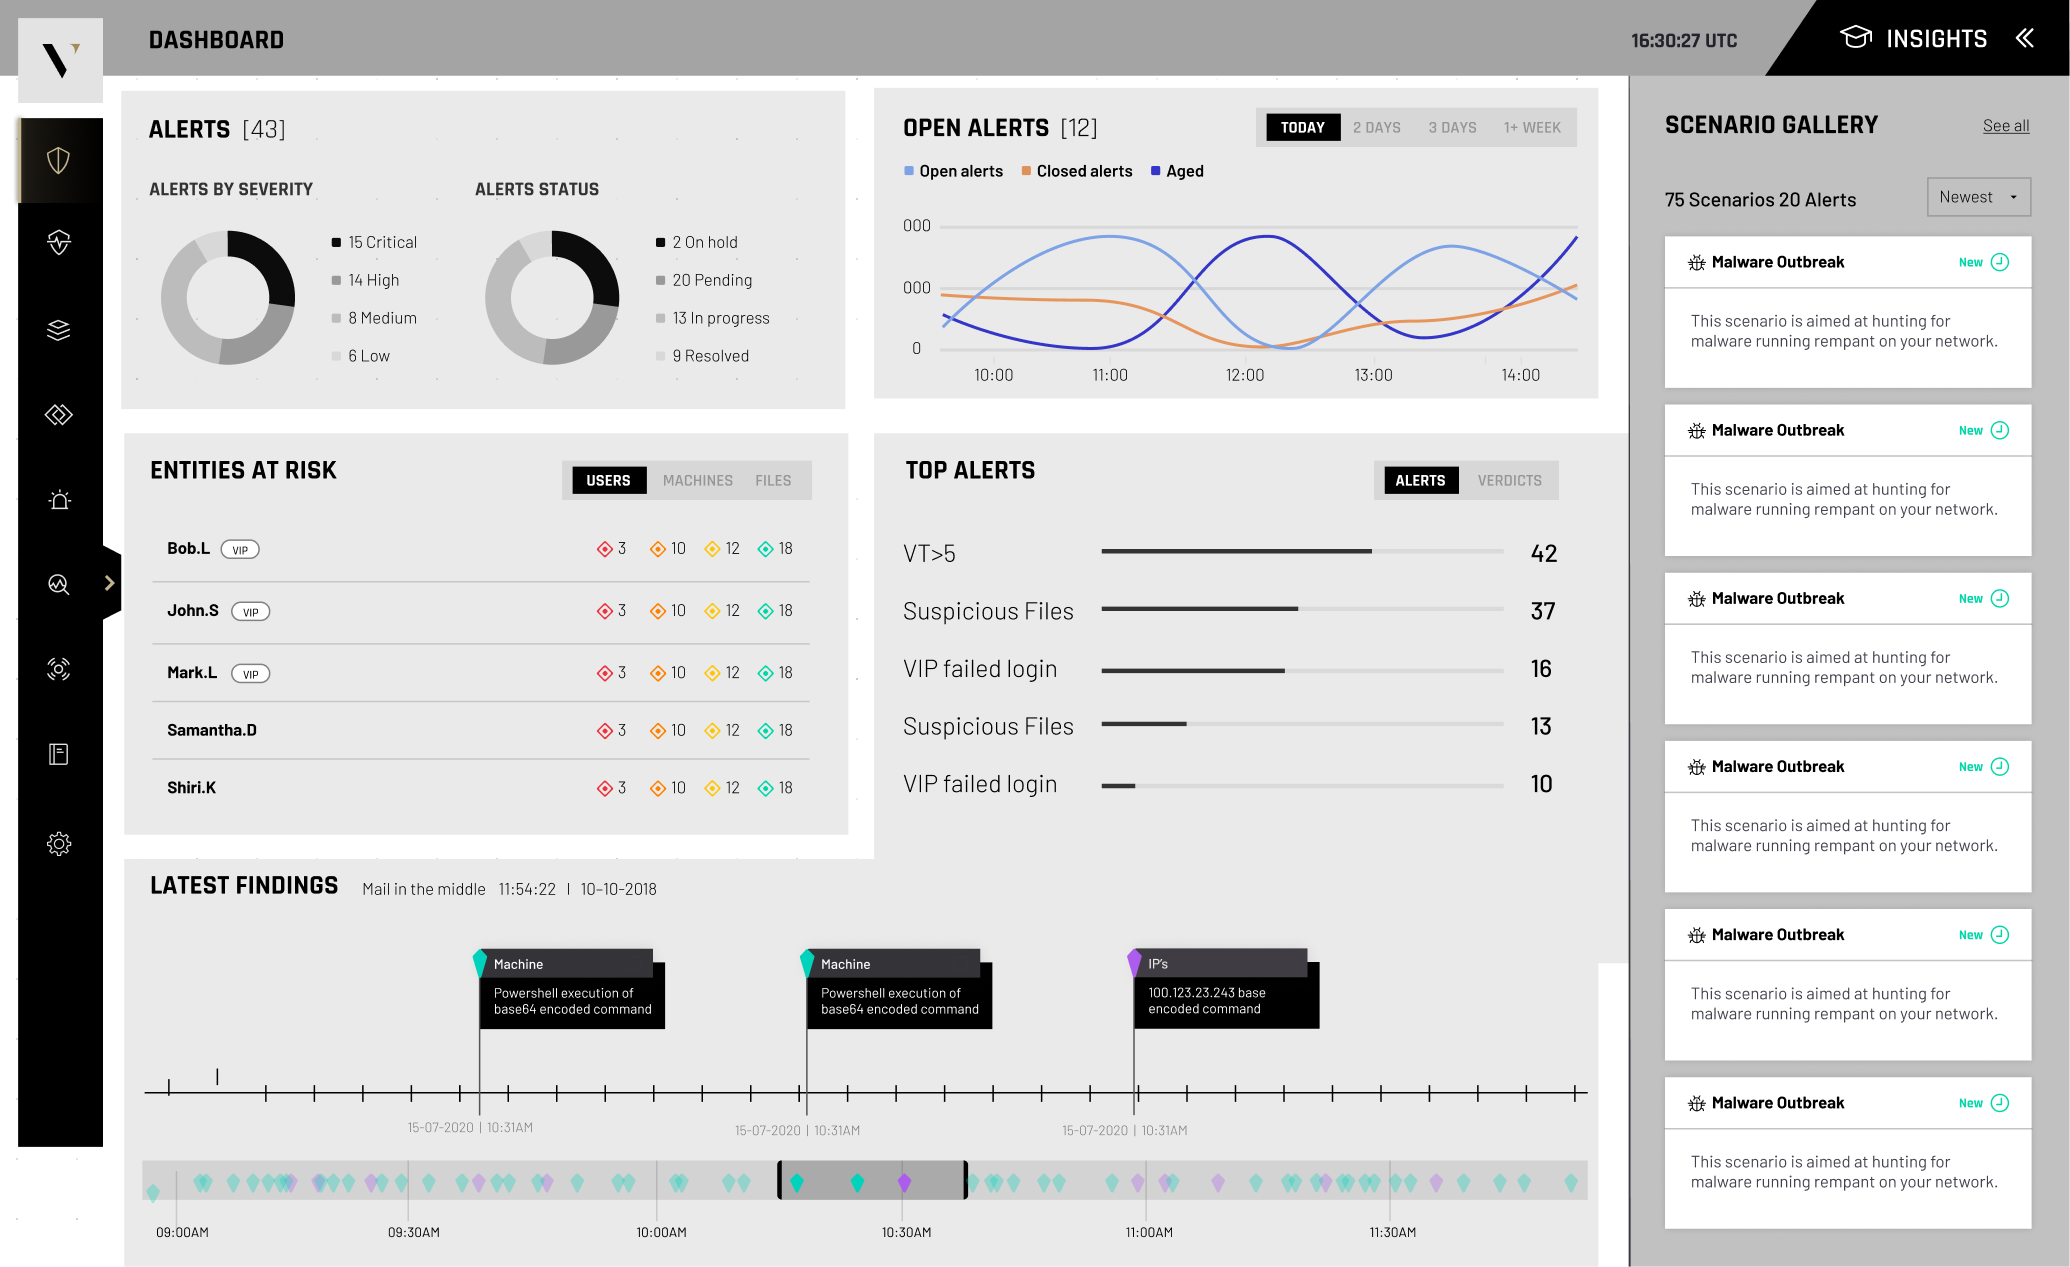
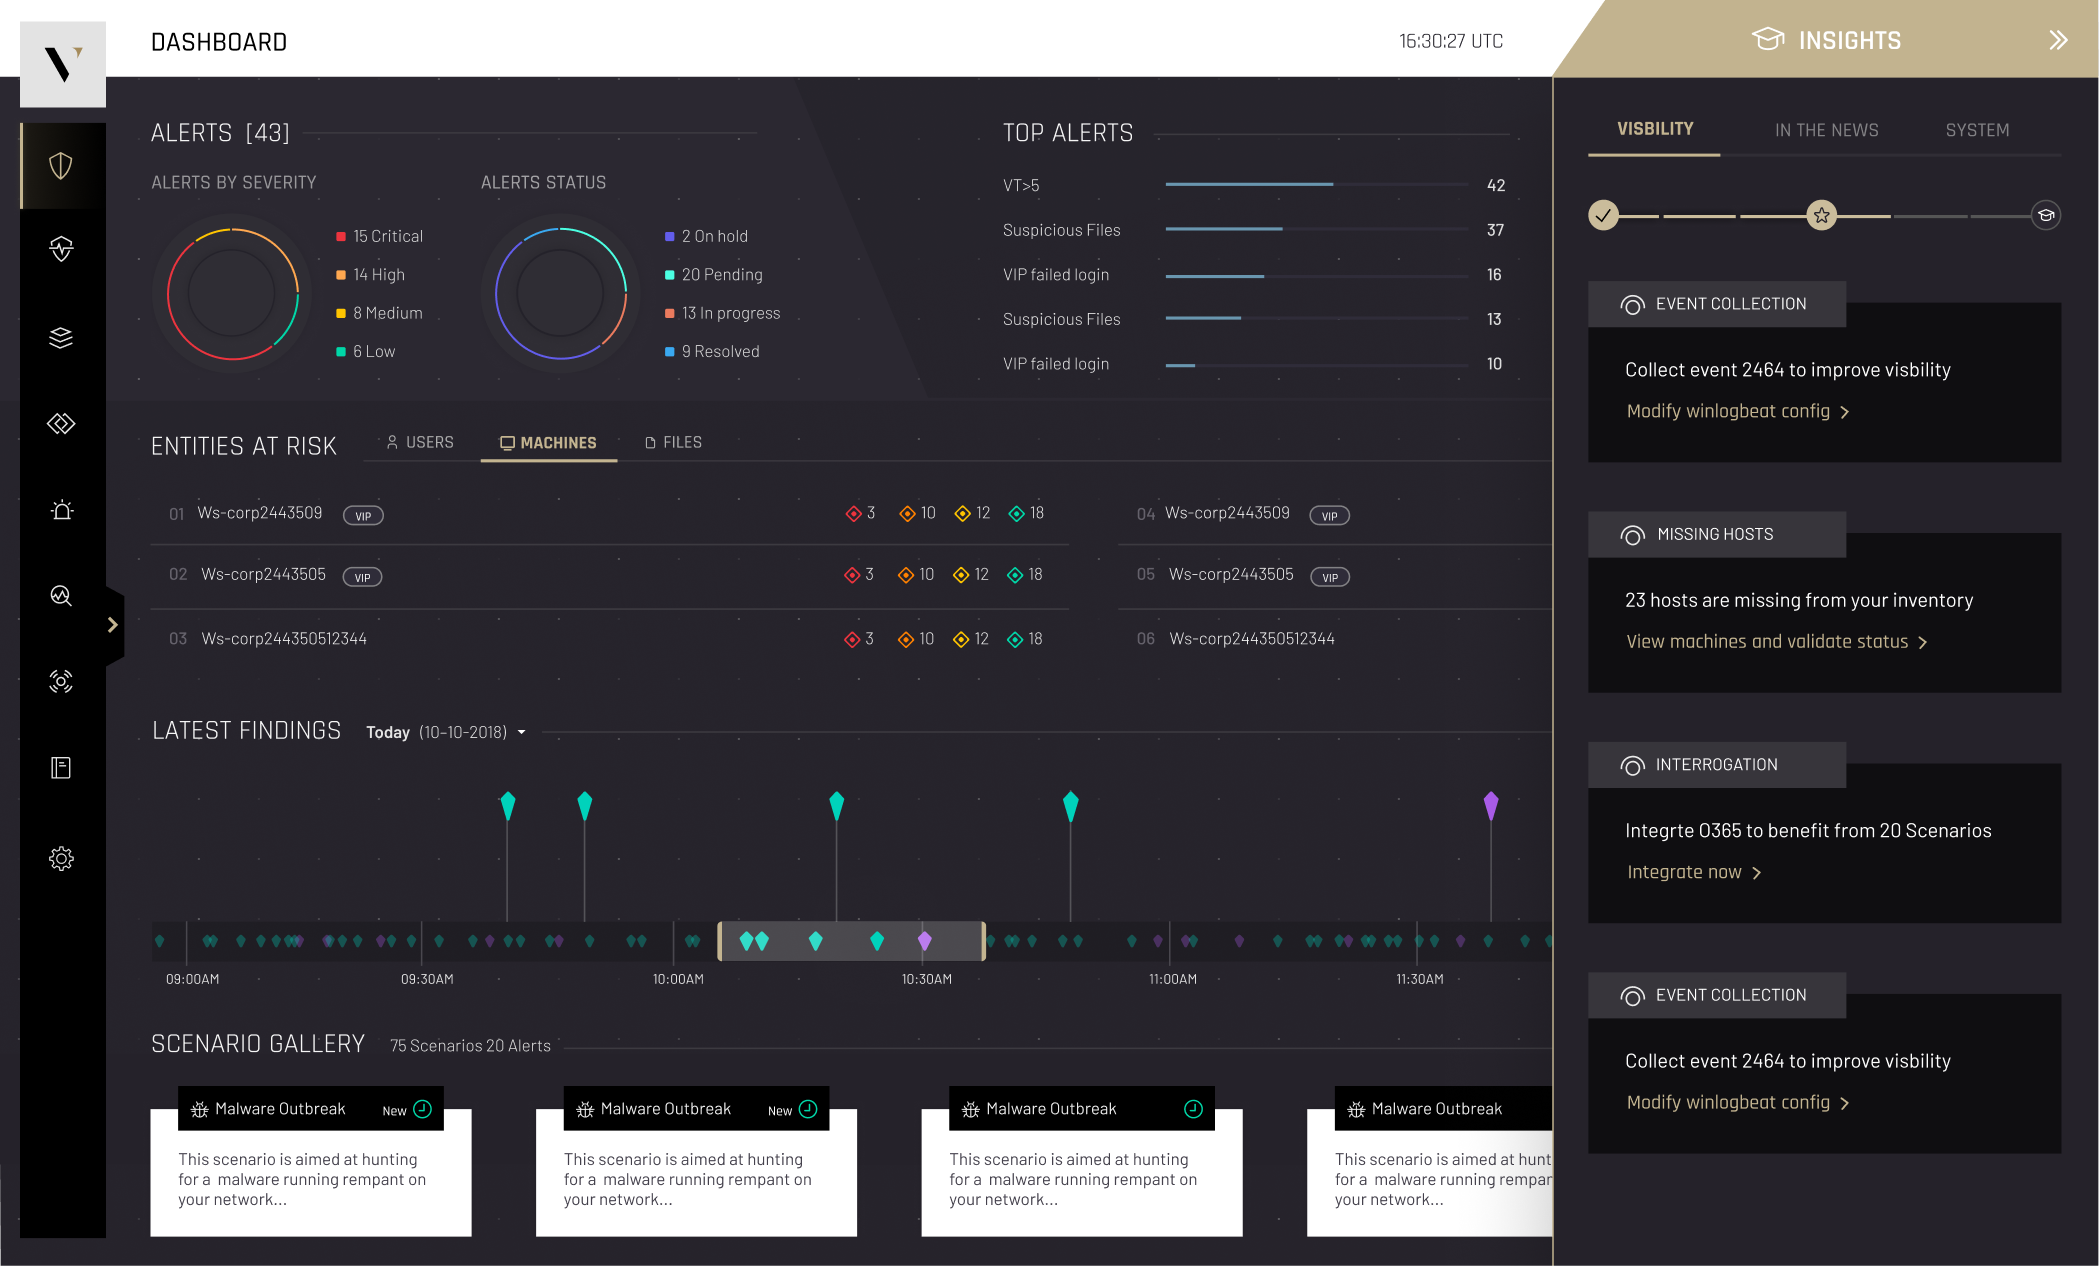
The final design
The final dashboard combines real-time monitoring, prioritization, and actionable insights in one view. A Security Health overview puts the overall state of the environment up top; Top Alerts highlights the most critical threats first; Entities at Risk surfaces affected assets, systems and users; an Activity Timeline gives context around events and trends; Recommendation cards turn data into clear next steps; and Protection Progress lets teams track how their security posture improves over time.


"The goal was never to show more — it was to make the most important thing impossible to miss."
Outcome & reflection
The redesigned dashboard gives security teams a clearer, more actionable view of organizational security. Stronger information hierarchy, better prioritization, and real-time visibility turn complex cybersecurity data into a practical decision-making tool — directly answering the problem the research surfaced: teams weren't short on data, they were short on clarity.
Looking back, the core lesson holds up: in a domain where an analyst faces thousands of alerts a day, the design's job isn't to display everything — it's to make the one thing that matters impossible to miss, and the next action obvious.
- Helps teams identify critical threats faster and reduce investigation time.
- Keeps analysts focused on high-priority risks while maintaining awareness of overall posture.